.png?width=750&height=750&name=Thought%20Leadership%20(3).png)


.png?width=750&height=750&name=Webinar%20Linkedin%201x1%20(3).png)


.png?width=1200&height=1200&name=Webinar%20Linkedin%201x1%20(6).png)

.png?width=750&height=750&name=Webinar%20Linkedin%201x1%20(11).png)
.png?width=2000&name=3x2%20Images%20(4).png)

.png?width=1200&height=1200&name=Webinar%20Linkedin%201x1%20(10).png)

Global Trade has grown to a value of 25.3 Trillion USD, reported in 2018 (wto.org 2019).
At the same time, the global availability of information & data has grown at 4x the speed of global trade (hbr.org 2019).
Meanwhile, 60% of procurement teams have no tools or rely primarily on improvised systems for Supplier Management. When looking at risk management, category management, and information sharing, that number is as high as 70% (Bain & Company 2018).
I’m no mathematician, but let’s try to make an equation out of the information above.
Global trade growth = more pressure on procurement teams to find cost savings + increasing global supply chain risks to manage. Multiply that by an exponential global availability of data & information.
Procurement's Information Overload
Would you say that these factors equal a sum that is manageable with Excel and homegrown solutions for supplier management?
Of course not.
This is why there is such a high focus on digital transformation, adoption of analytics, and automation/cognitive procurement technologies. As seen in the graphic below, 75% of CPOs have already begun to invest in Data Analytics whilst 62% plan to invest in Automation & 64% plan to invest in AI technology in the coming years.
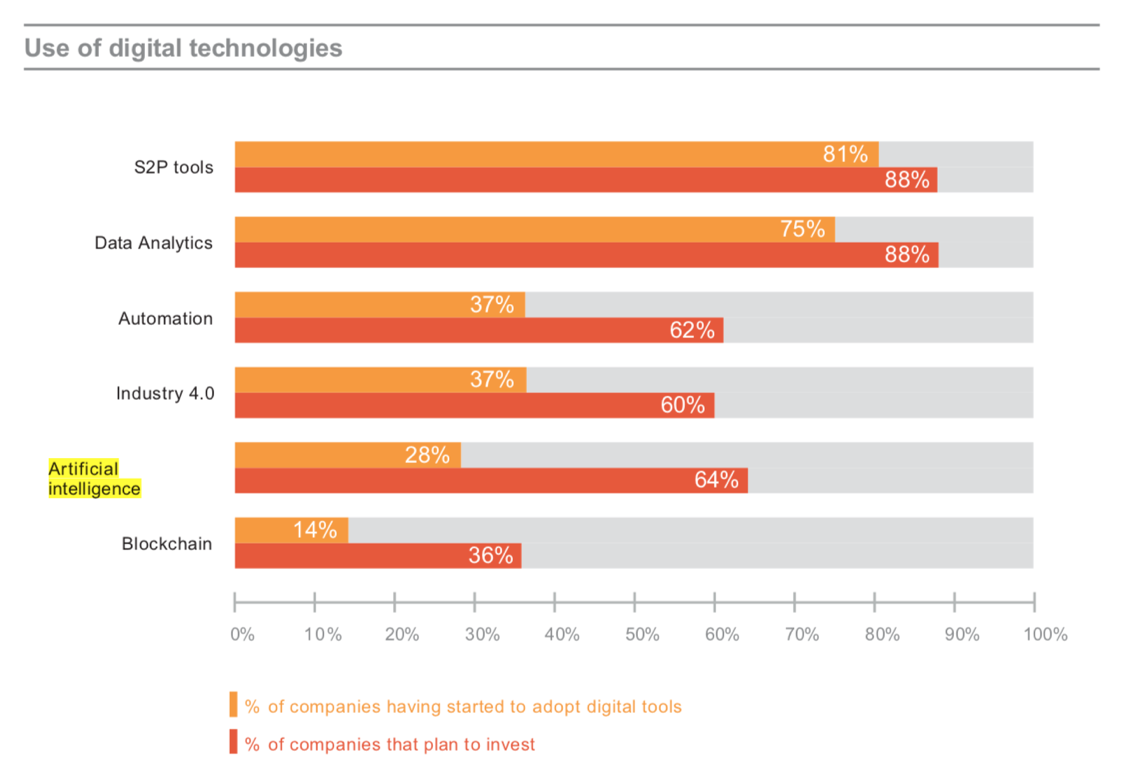 Source: PwC 2019
The Need for Supply Chain Visibility
Visibility and trust is a hot commodity in modern supplier management. Buying with trust and transparency, backed by data-driven insights, is a much sounder investment than going with your gut.
That’s why 37% of CPOs who responded to Ardent Partner’s 2019 CPO Rising Report said that better visibility & analytical capabilities were the #1 needed area of improvement to reach ‘next level procurement performance’. 84% of CSCOs (chief supply chain officers) responded in an IBM survey at “lack of visibility” was the biggest challenge they faced.
45% of Procurement Leaders answered in the 2018 CPO Survey from Deloitte that Lack of Data Quality was their largest barrier to adopting new digital procurement solutions. 46% of Procurement Leaders believed that lack of data integration between business systems is the biggest barrier to adopt and apply digital technology within their procurement organizations.
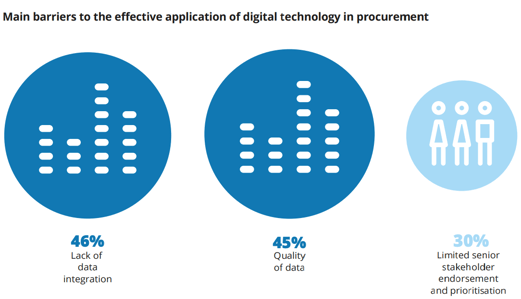 Source: Deloitte CPO Survey 2018
Enough with the statistics already… What does this really mean for procurement?
Procurement teams are drowning in information & starved for intelligence.
Sometimes it’s hard to see the woods for the trees, and macro trends suggest that procurement and supply chain complexity is only becoming more complex. As data & information availability grows, and the technology/procurement solution adoption rate struggles to keep pace, it’s important to take a second, reflect, and ask yourself the following question:
How can my procurement organization turn data & information into insights & intelligence?

Turning Supply Chain Information Into Valuable Intelligence
Data is the #1 global commodity
We’ve all heard it before… Data is the new oil.
Supply Chain Data & Information has become a make or breaks commodity in various organizational functions regardless of industry vertical. The depth of global connectedness has grown at an alarming rate, and this is due to the abundance of data & information.
More data means more opportunities for intelligence, but it can also make for more confusion if not sourced or stored correctly. As suggested in a study by IDC titled Data Age 2025, predictions made show that worldwide data creation will grow to 163 zettabytes (ZB) by 2025. For those tactile learners, out there, just like me, who may not be familiar with the magnitude of a zettabyte, it’s 10x the amount of data produced in 2017.
This sheer mass of data availability will come with its own challenges surrounding data security, visibility, and data quality. At the same time, availability & connectivity poses opportunities for societies and businesses alike, including the procurement function. From the same report, IDC predicts that by 2025, 75 percent of the global population will be connected, creating, and interacting with data (IDC 2018).
Gathering & Visualization
Harnessing data as a valuable commodity it can prove to come down to two primary focuses; Data Gathering & Data Visualization.
A great starting point for turning data & information into insights & intelligence is to ask your team the following 3 questions;
- What data do we want to source?
- Where is that data?
- How do we want to see the data?
Unlike oil, Data isn’t a depleting resource, but rather growing with a great abundance. The procurement lifecycle is filled with thousands of valuable data points spanning from supplier master data to spend to lead times to production figures. Many datasets are hard, structured, and numerical, and others are soft, unstructured, and qualitative. Whatever kind of data it is, there’s likely a solution on the market to help you dig it up!
Some of the data may already be available in structured data formats within your existing business solutions. This is where the interconnectivity of business solutions is key, and making sure your solution providers have strong API capabilities is a must! One of the prerequisites to application interconnectivity is data quality and organizational alignment on processes for gathering and storing data.
Unstructured data (information in a word, spreadsheets, PDF, email, social media, etc.) can also pose massive potential for data intelligence. With this being said, it’s important to let modern technology work for you. Instead of trying to reinvent the wheel, hop onto premade rocketships. “80 percent of stored data is estimated to be unstructured. Text analytics can give insight into supplier information on social media” (cips.org 2019).
Once you know what data you need, and where you’re able to source it from, then you can begin to think about how the data should be digested, or analyzed.
Best put by Juliet Frost from her article, Five tips: How procurement can use big data effectively, “People are programmed to understand patterns so graphs are more instantly understandable than numbers” (cips.org 2019). She suggests that color (logic), formatting (bar, pie, line) & historical elements are all very important factors to keep in mind when visualizing data for analysis.
The answers are in the data. You just need to make sure you’re asking the right questions.